Nozzle Airflow Analyzer
Overview
Despite generating strong suction, our vacuum's cleaning performance fell short. The airflow around the nozzle wasn't fully understood, making it unclear where the air actually flowed. As a result, modifications to the vacuum did not improve its cleaning results. To solve this, I developed an airflow visualization system to accurately map the flow patterns around the nozzle, offering valuable insights to enhance performance. This system is Shark's first test rig capable of comparing airflow data across different vacuum brands.
Problem
- Making changes to the nozzle of the vacuum does not produce the desired results.
- We do not have quantifiable data to compare different nozzles or different configurations.
Goals
- Get quantifiable data for nozzle airflow.
- Must be able to measure airflow from different vacuums regardless of manufacturer.
- Must be cost-effective.
Smoke Box
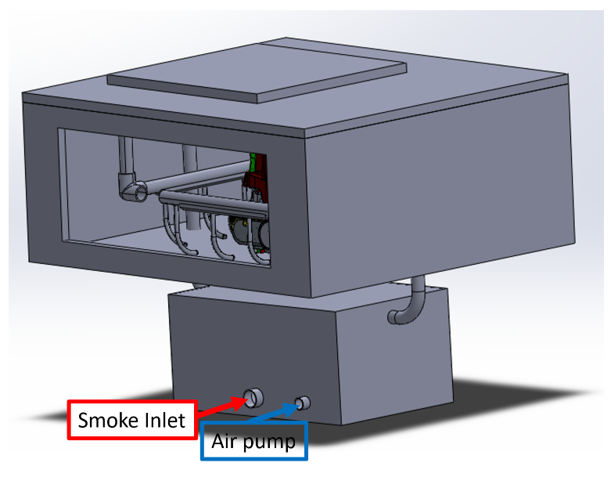
The initial project idea involved designing a smoke box where a pipe system would feed smoke around a nozzle, allowing the smoke to be visually observed as it was drawn into a vacuum. This setup aimed to provide a clear representation of airflow patterns around the nozzle.
Flow Optimization
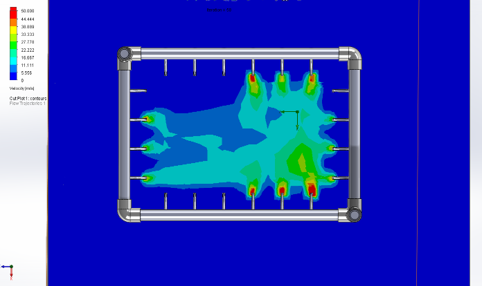
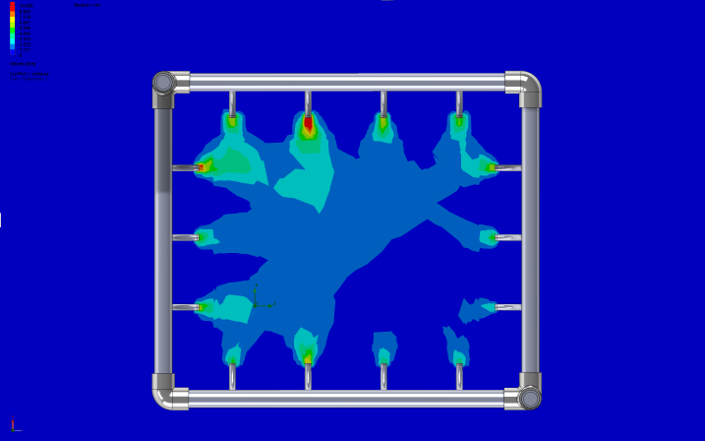
To improve the efficiency of this setup, I used SolidWorks Flow Simulation to optimize the piping system. By running simulations, I was able to analyze and adjust the airflow patterns within the pipes to ensure the smoke flowed more evenly through the exit tubes. This process helped refine the design, making the smoke distribution more consistent for better analysis of the nozzle's airflow.
Limitations
- We cannot see exactly how modifications affect airflow.
- Cannot be used indoors because of smoke triggering smoke detectors.
- Difficult to adapt to other vacuums.
Final System
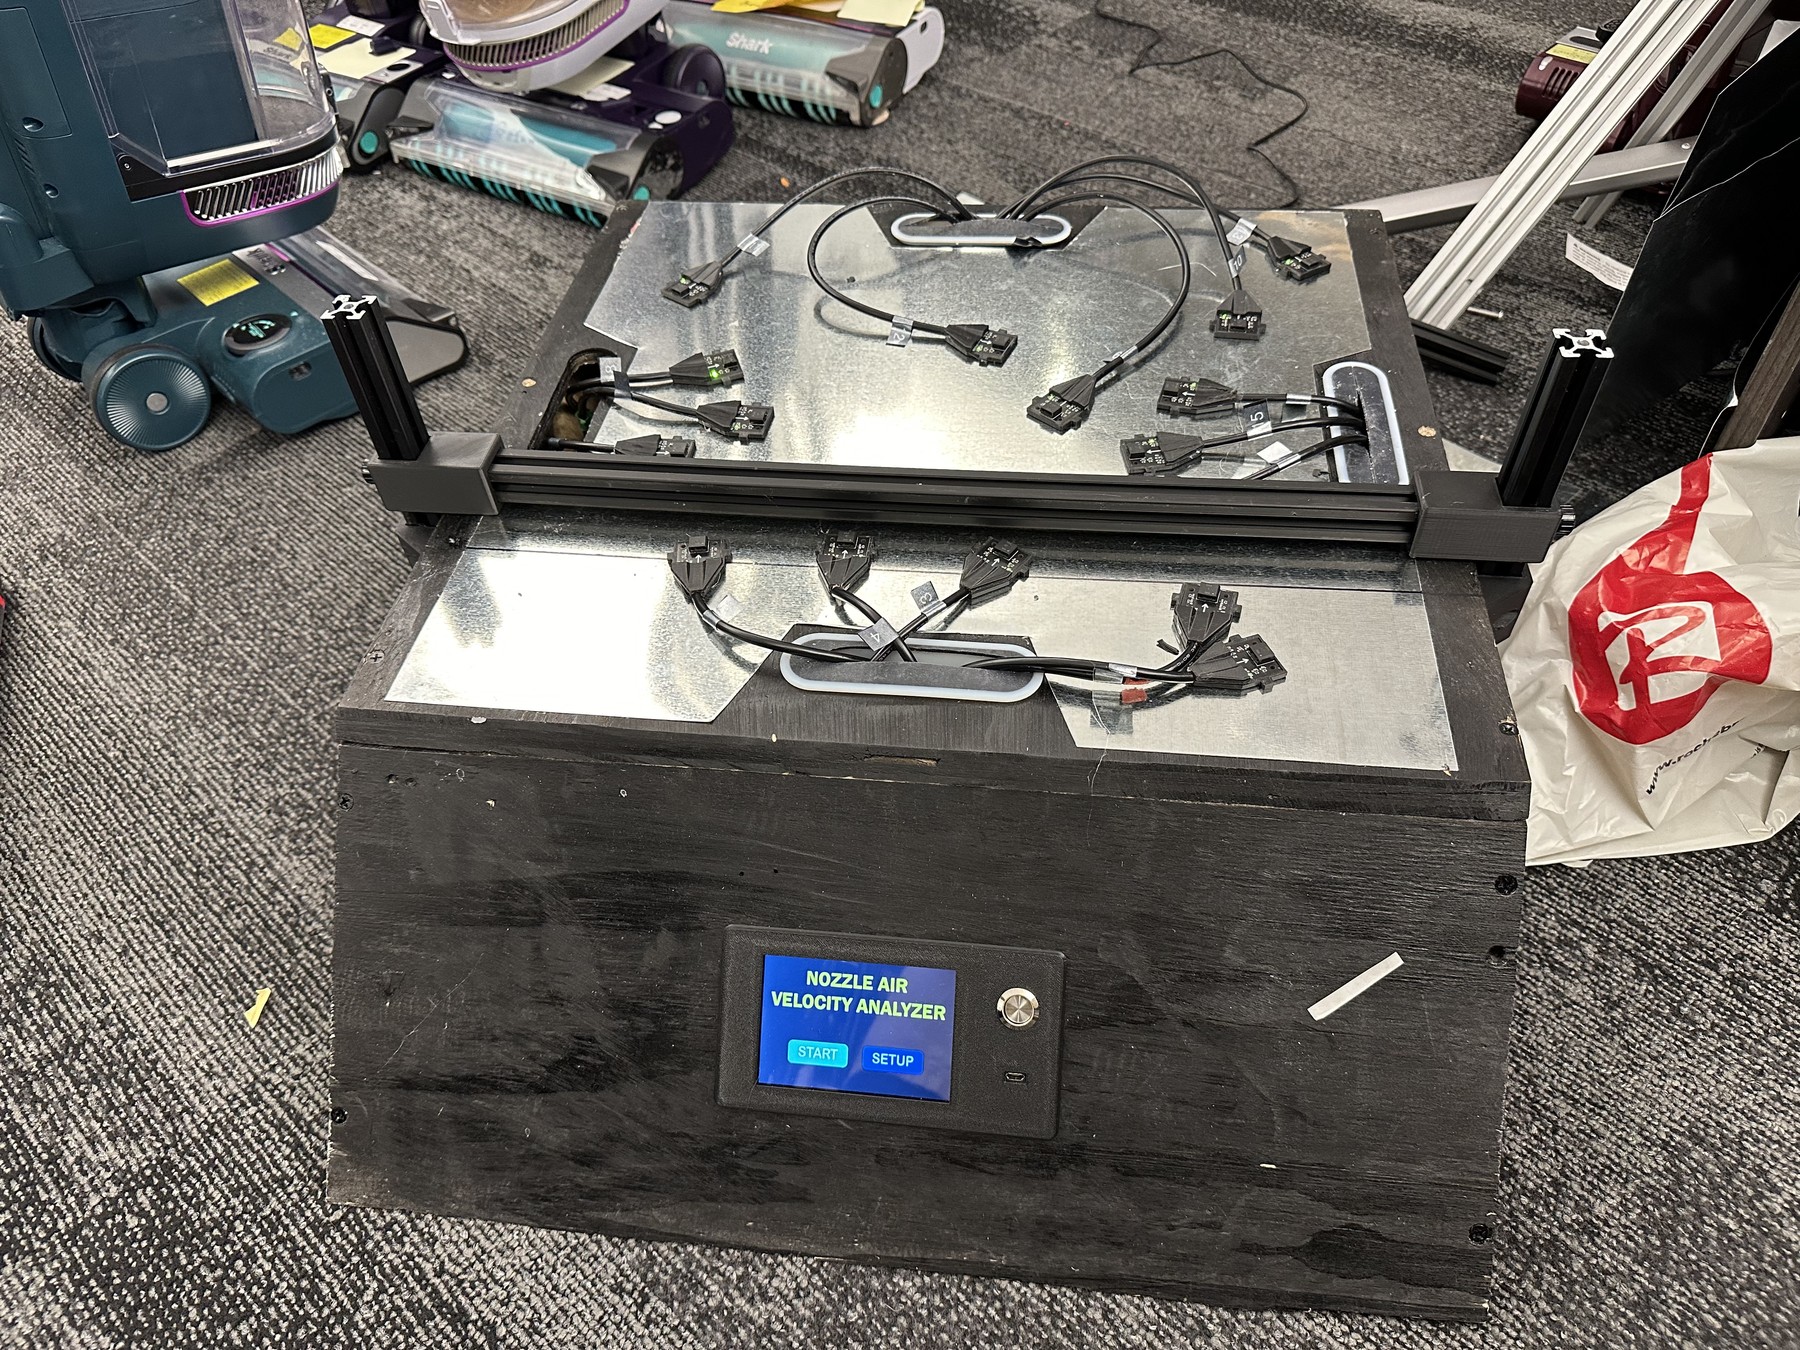
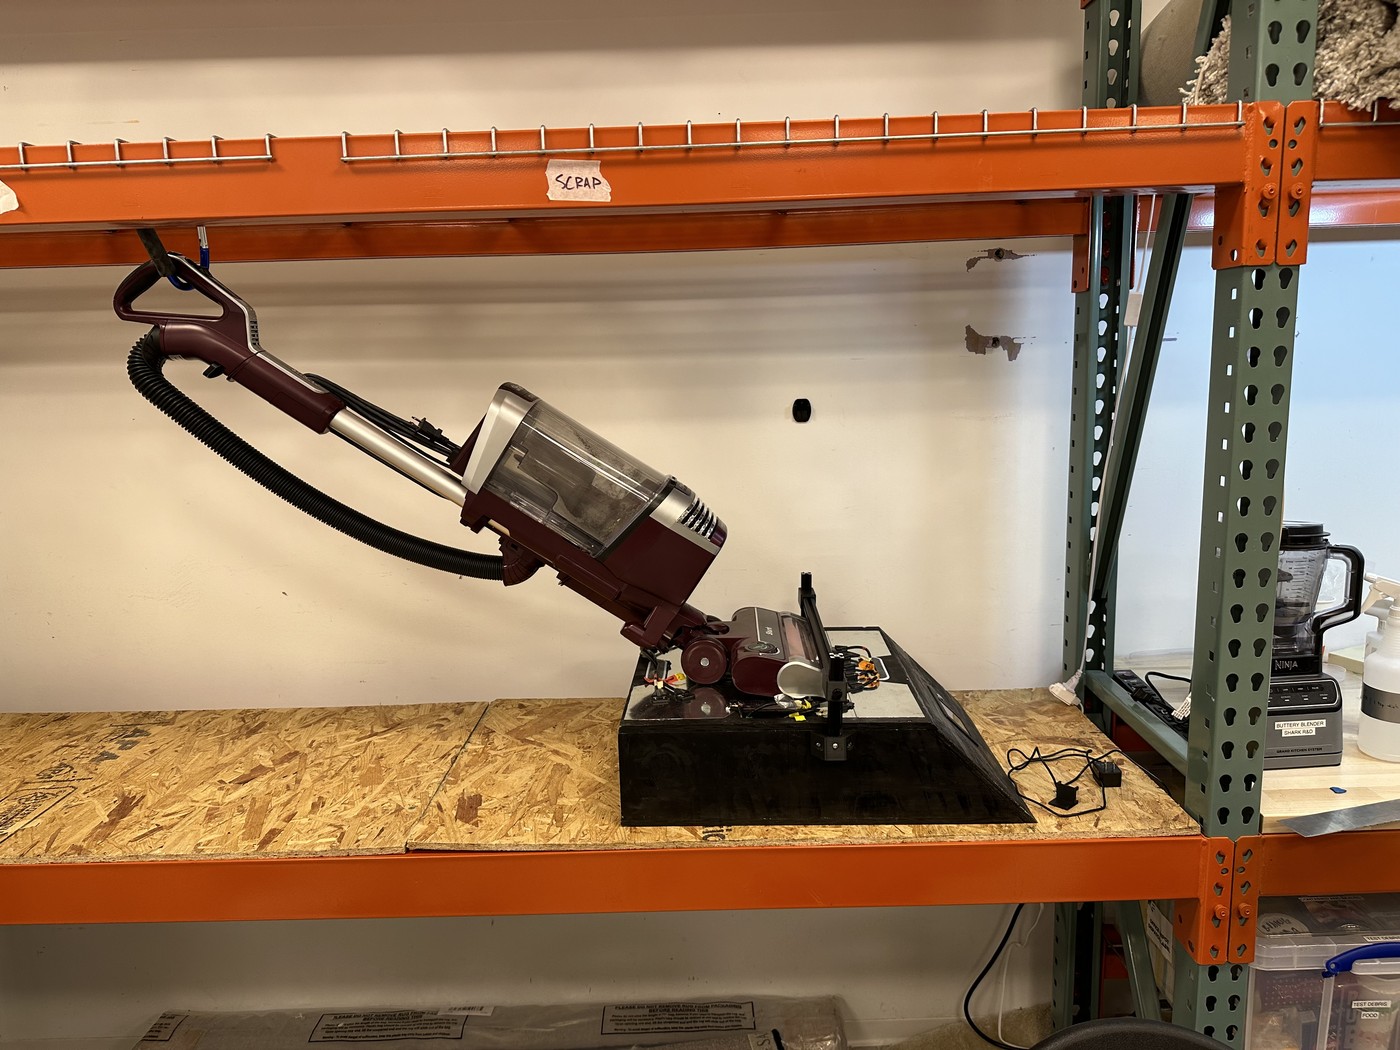
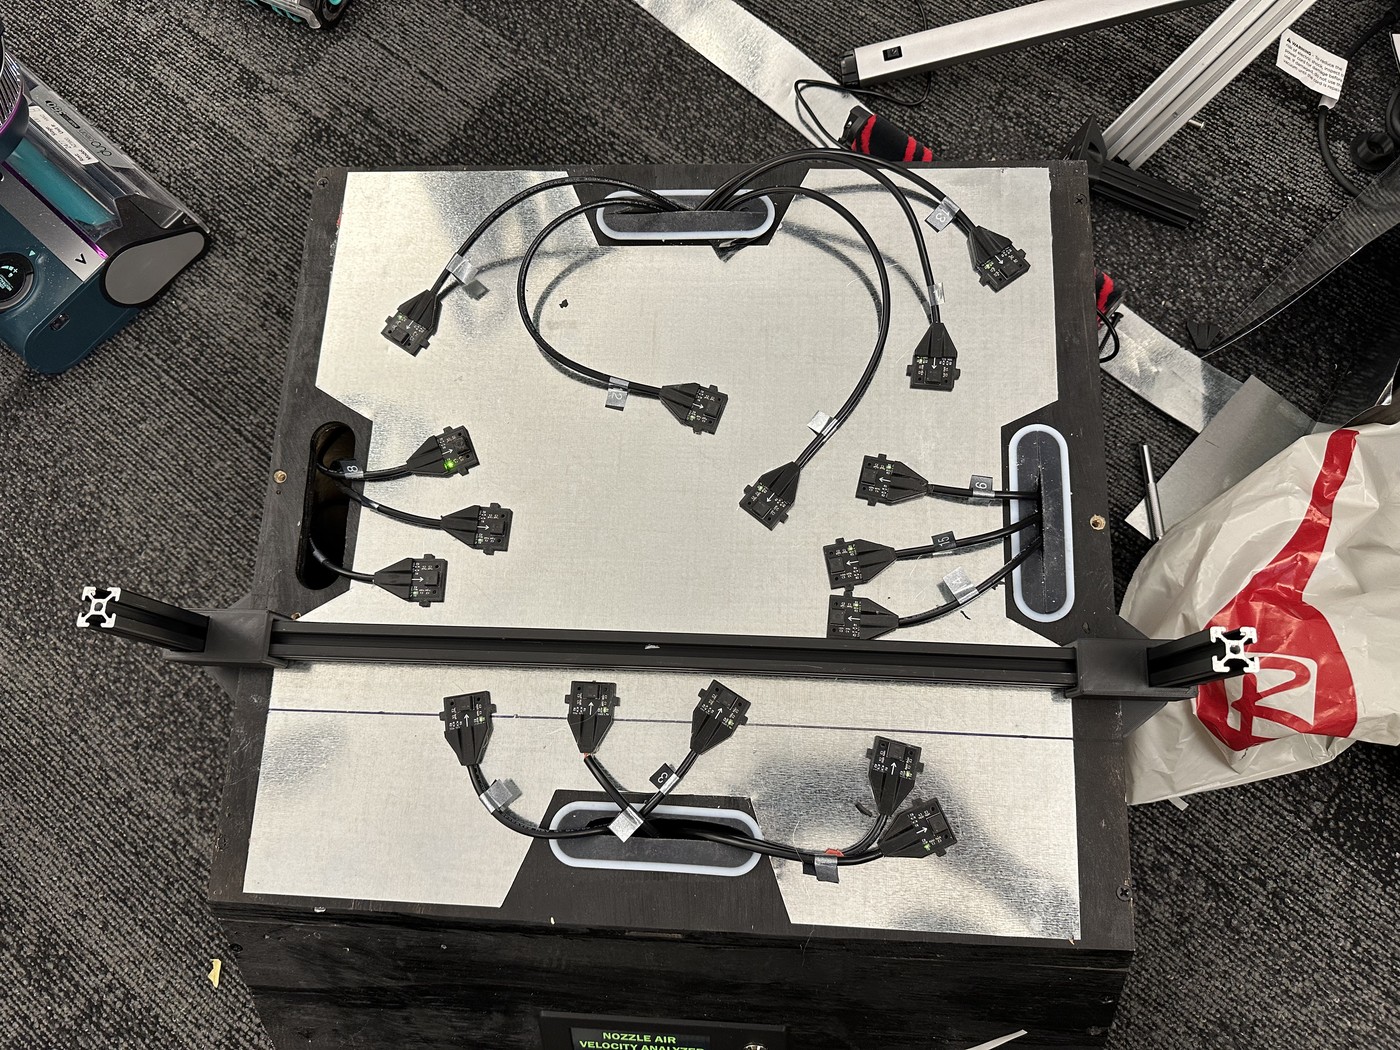
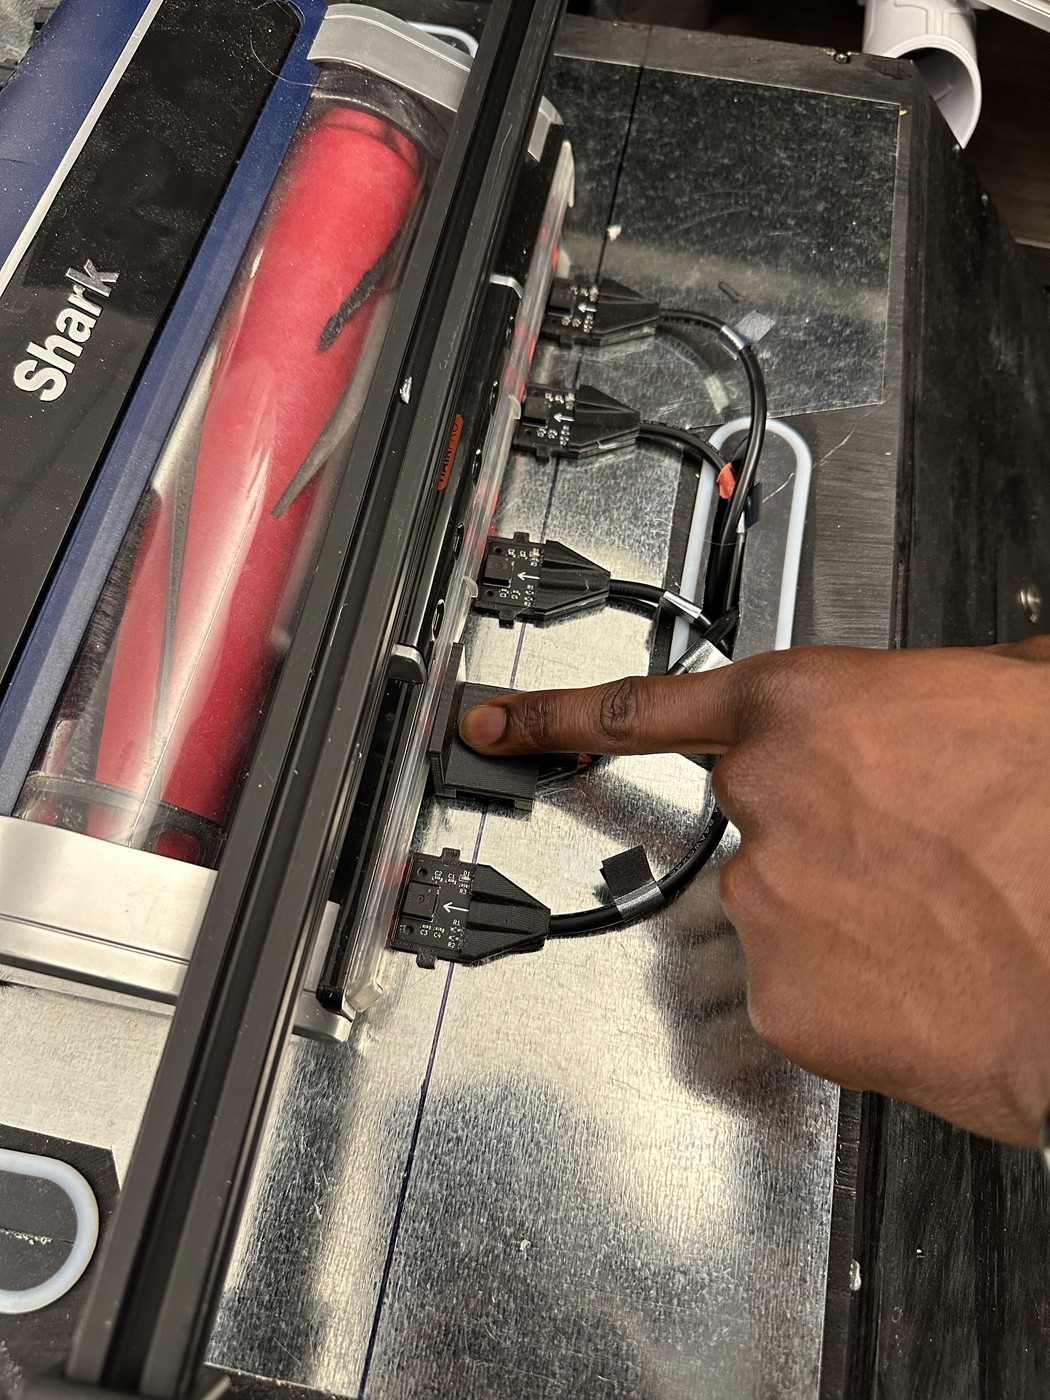
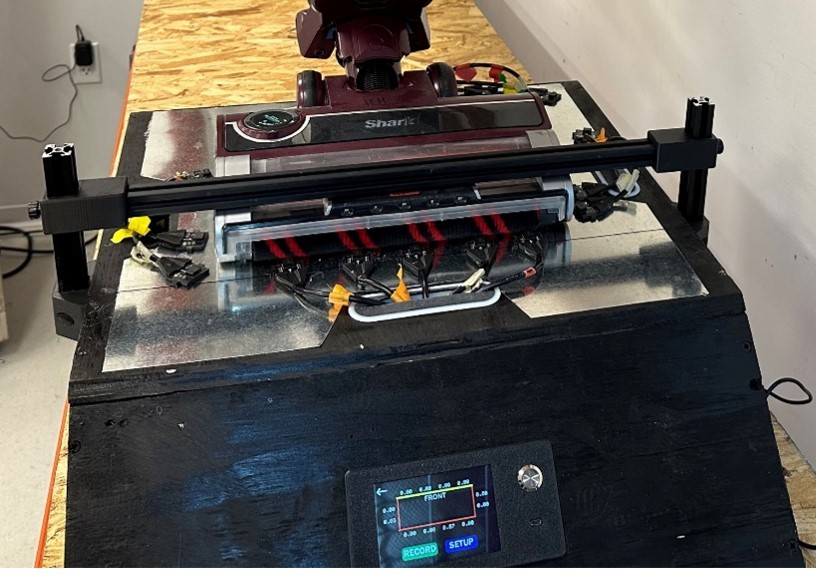
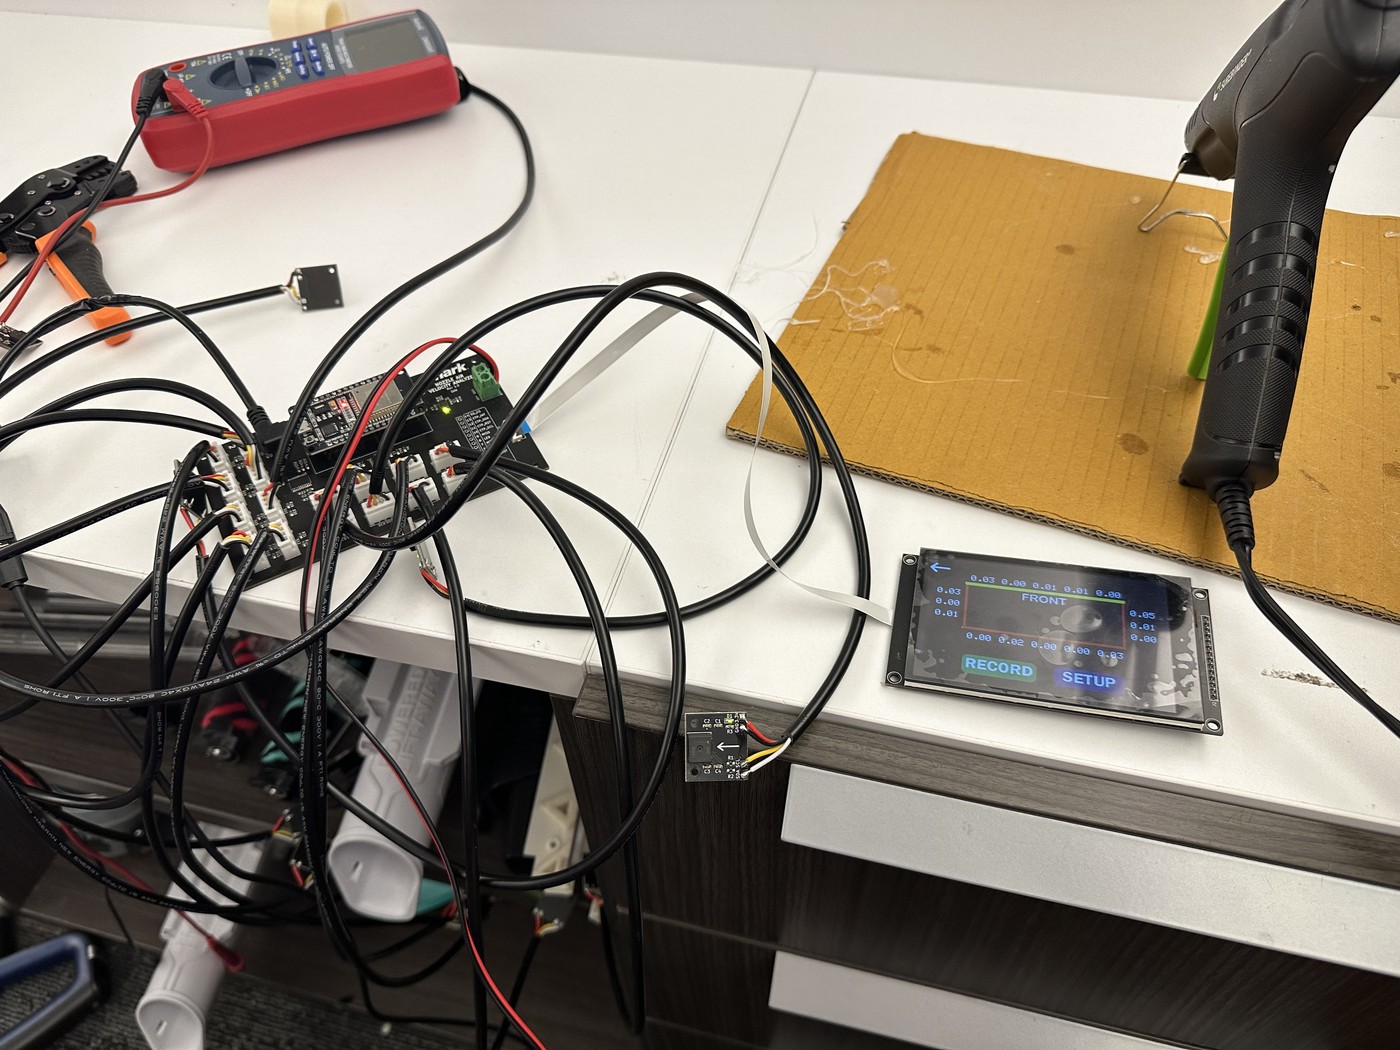
The final system features 16 airflow sensors strategically placed around the vacuum nozzle to capture airflow data. The data can be monitored in real-time on a screen or saved as CSV files through a desktop application. This setup ensures a seamless and efficient process for gathering airflow data from different vacuums.
CAD
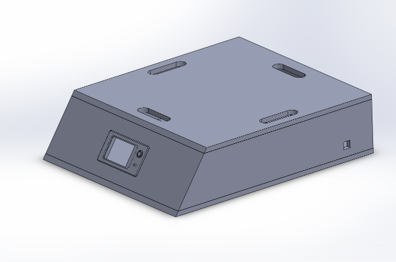
The model was designed in SolidWorks and built with wood. The face plate was 3D printed.
PCB Design
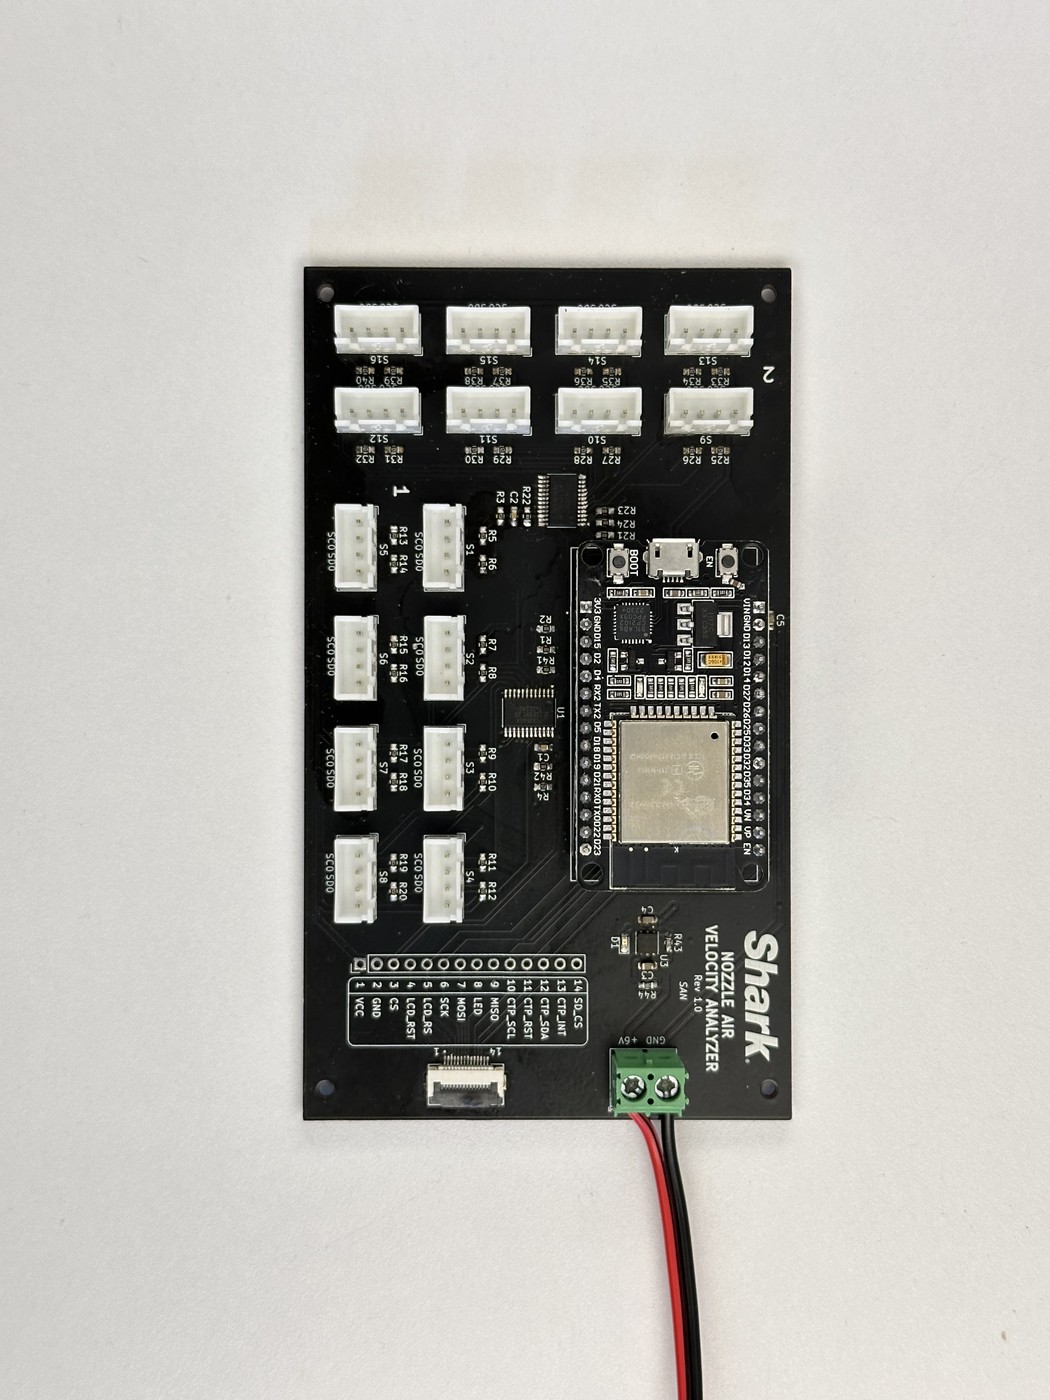
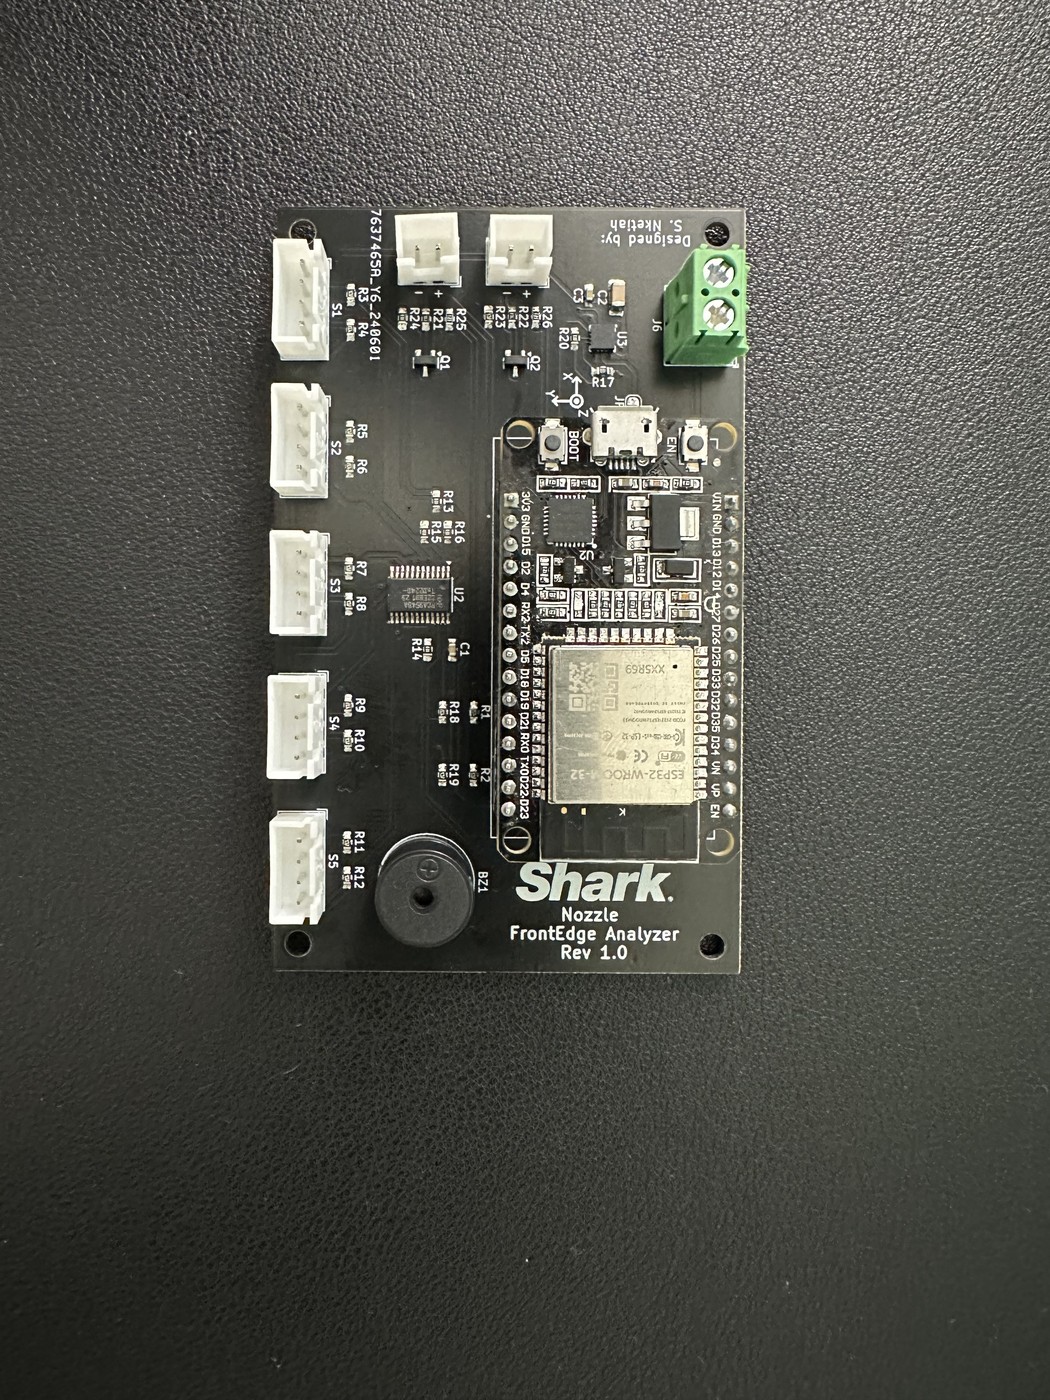
I developed custom airflow sensor boards using KiCad, optimizing the sensor placement for precise alignment with the vacuum system. Additionally, I designed a main board powered by an ESP32 microcontroller, capable of supporting up to 16 airflow sensors and an LCD for real-time data visualization.
Arduino Code
I wrote Arduino code to read data from all the sensors and display it on an LCD screen. I also created an intuitive user interface, ensuring that anyone can easily operate the system.
Python GUI
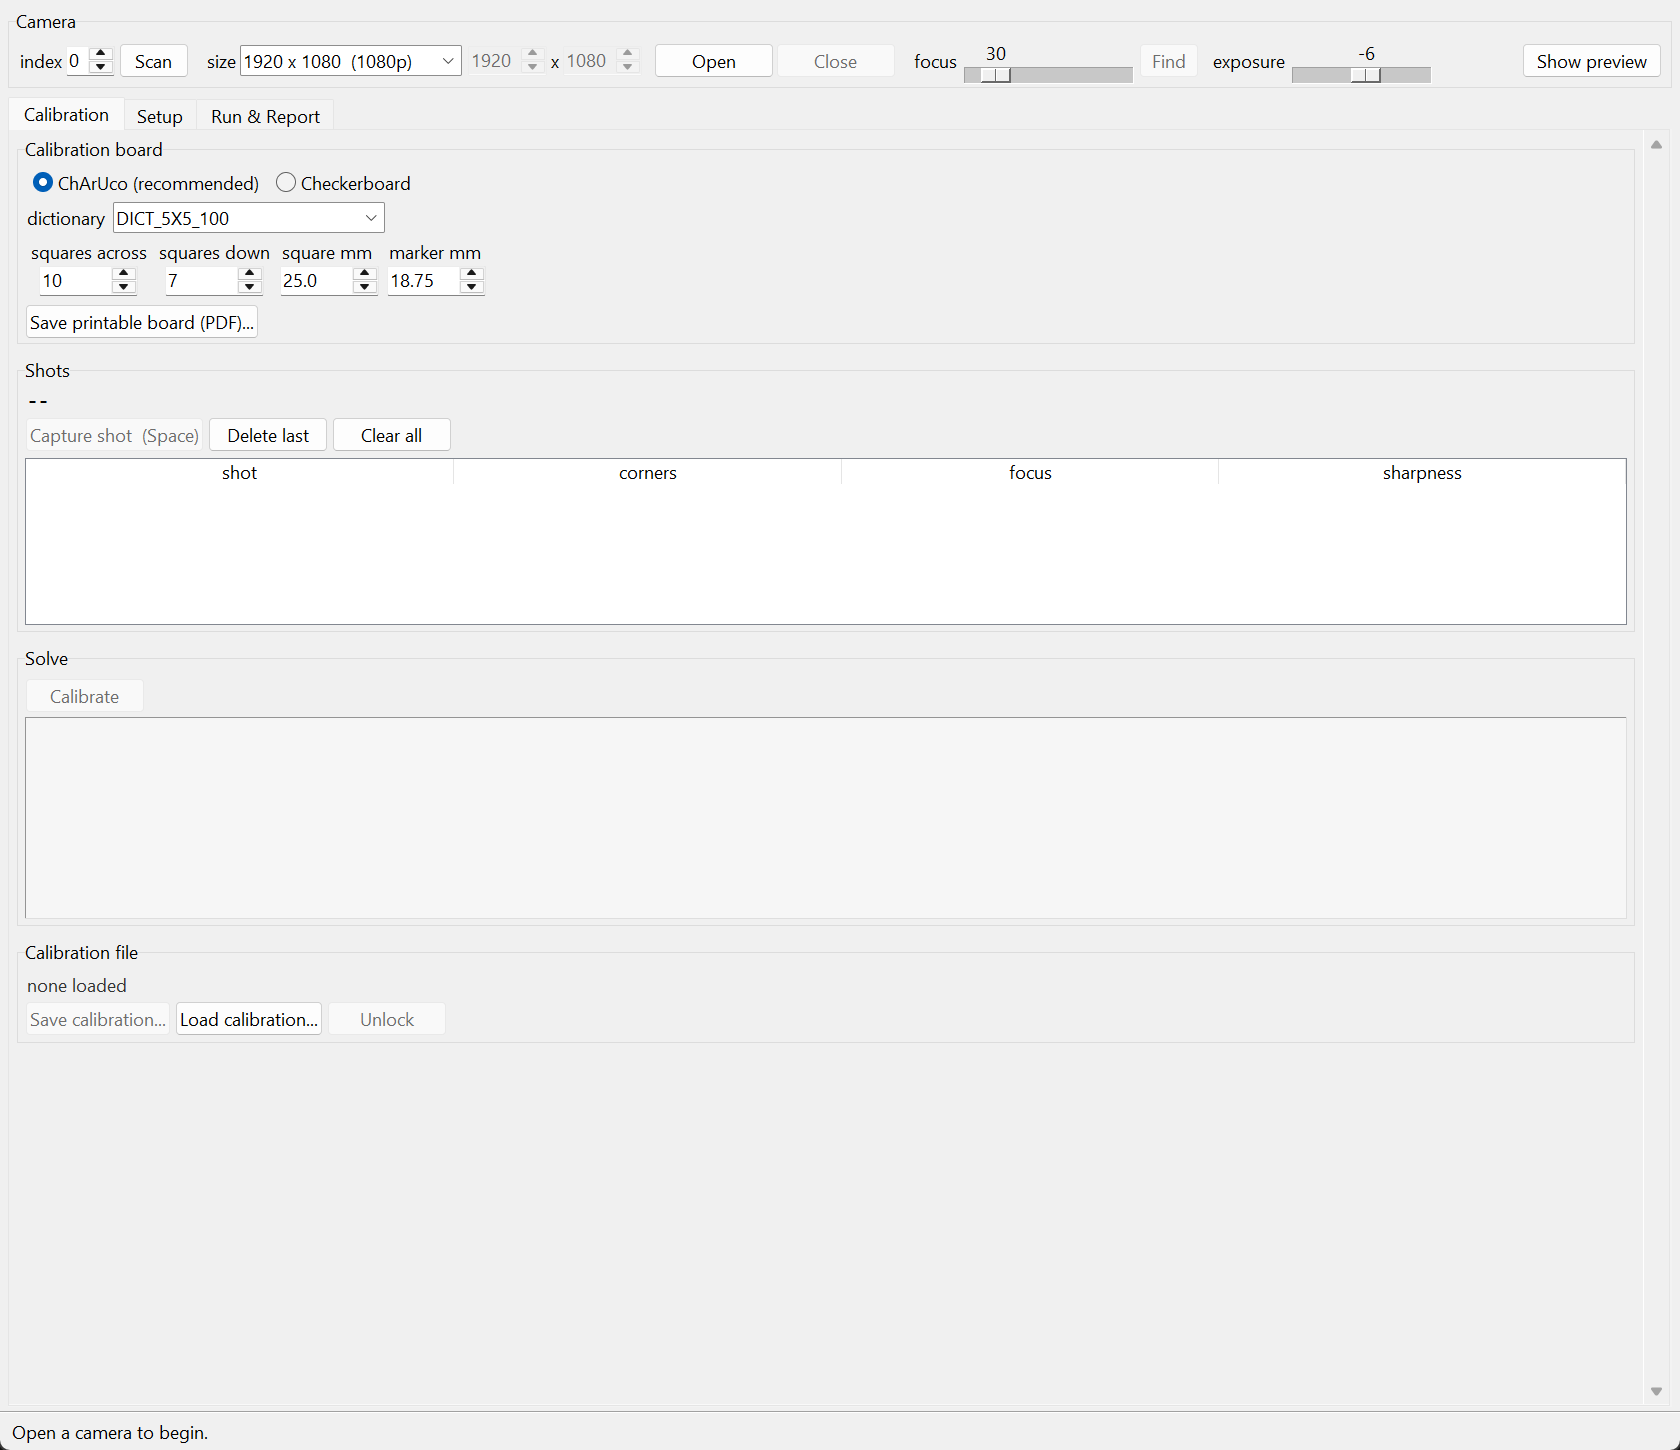
I created a desktop application using Python and PyQt that not only displays live data from the airflow sensors but also processes the data in real-time. The app allows users to easily save new data, load previously recorded data, and even overwrite old data when necessary. One of its key features is the ability to process and analyze airflow results by calculating averages, which is particularly useful when comparing vacuum edge airflow performance. This functionality provides users with a simple way to review and compare old and new data, enabling informed decisions.